


Global stock markets had a rude awakening last week when signs that China’s economy is slowing became unmistakable. Not so the astute market observers who have been tracking the trade data on China – or so reports the Wall Street Journal.
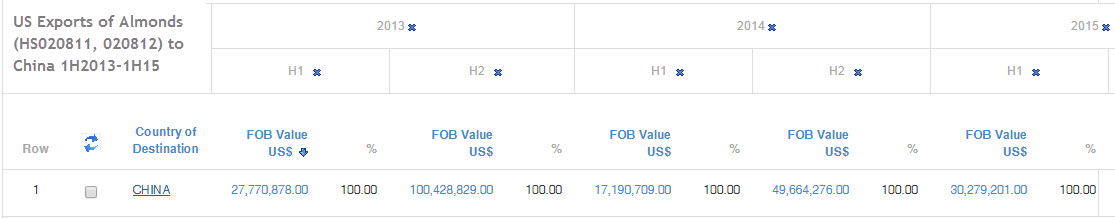
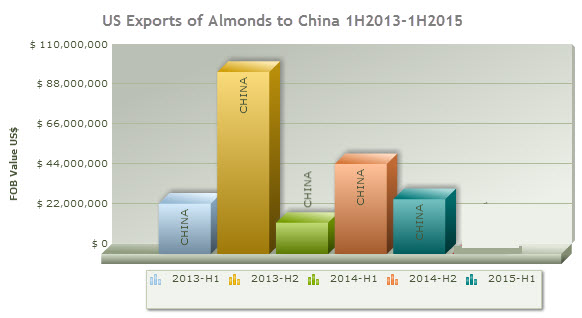
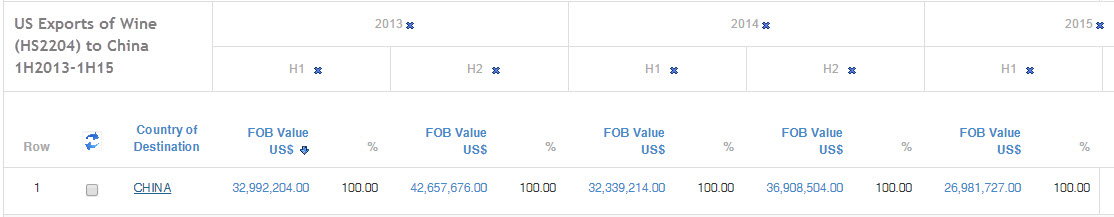
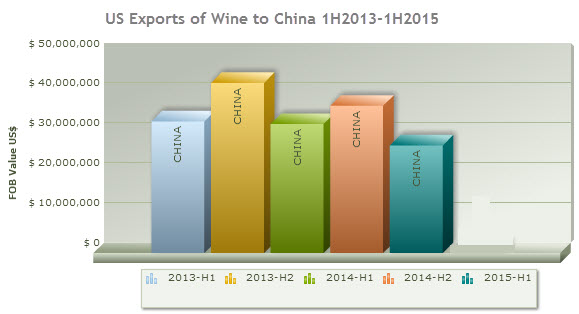
According to the WSJ, one trade adviser was alerted to impending trouble by the data on US exports of almonds, California wines, and other products popular with the rising Chinese middle class. The healthy growth trend in shipments to China stalled, reasserted itself in 2014, then reversed in 2015, suggesting domestic demand was flagging.
You can see the pattern in our trade data on US exports of almonds and wine to China (click on the graphics to enlarge):
We found a similar pattern in our trade data on total US exports to China as well as for individual products such as soybeans, passenger vehicles (HS520100), cotton, copper scrap and aluminum.
The WSJ notes that earliest warning signs could easily have been missed as the “canary in the coal mine” – volumes shipping through the West Coast ports of Los Angeles and Long Beach – was choked by labor dispute-driven slowdowns.
In hindsight, the import data held warnings too, as China flooded global markets with inexpensive goods (causing several US domestic industries to petition the US International Trade Commission for relief – see, for example, these blog postings).
The WSJ concludes that the slowing Chinese economy could be on its way to a more sustainable economy … which will mean a change in the mix as well as the volume of imports and exports (less road-building equipment, more California wine?).
You can read the Wall Street Journal article here.
To see samples of our data on China and its trading partners, and learn how to use trade data to track what happens next, just ask us.
Related: