
Descartes Datamyne global trade data reports changes in U.S. inbound trade, top trade partners, and top imports over the short but impactful life of International Emergency Powers Act (IEEPA) tariffs.
Key Takeaways
- U.S. imports declined 4.5% in the 12 months following Liberation Day.
- The U.S. trade deficit narrowed as imports slowed.
- Mexico strengthened its position as the top U.S. import source.
- China lost significant U.S. import share, while Taiwan and Vietnam gained.
- Maritime import volumes fell 4.3%, with China origin volumes down sharply.
- Import patterns shifted by product, with cars declining and automatic data processing (ADP) machines surging.
- Tariff and trade policy remains highly fluid, creating continued uncertainty.
In February, March and July 2025, the first ever tariffs imposed under IEEPA on imports from Canada, China, and Mexico cited the emergencies of illegal immigration and drug trafficking.
On April 2, 2025, dubbed “Liberation Day”, the administration rolled out reciprocal tariffs on the imports of most U.S. trading partners with the aim of correcting trade imbalances. Subsequently suspended and modified, these tariffs did not actually come into force until August 2025. Six months later, on February 20, 2026, the Supreme Court decided that the executive power under IEEPA did not extend to imposing tariffs, and they were cancelled.
Descartes Datamyne trade data provides a measure of the global market shifts during the IEEPA tariff period. The following is a summary of U.S. Census and bill-of-lading data comparing the import activity during the 12 months from May 2025 through April 2026 with the prior 12 months.
Keep in mind: The IEEPA tariffs were not the only government policy reshaping trade over this period. The tariffs were positioned as an incentive to negotiate new trade deals (and lower rates) as, for instance, Vietnam did. Other tariffs were imposed during this time, including Section 232 tariffs on aluminum and steel. As soon as the IEEPA tariffs ended, 122 tariffs took their place.
Falling Imports and a Shrinking Trade Deficit (214)
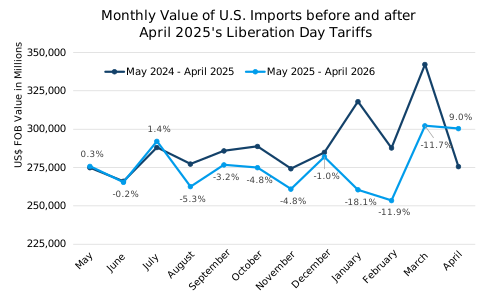
Predictably, U.S. imports declined 4.5% from May 2025 through April 2026 compared with the same period a year earlier, as captured by U.S. Census data (see Figure 1).
Figure 1. Value of U.S. Imports in the 12 Months before and after IEEPA Tariffs
Source: Descartes Datamyne U.S. Census Import Data
In the immediate wake of the reciprocal tariff announcement, import growth slowed to 1.7% year-over-year in April 2025.
Import growth flattened May through July, then fell well behind in August (when IEEPA tariffs took effect) through December. The decline deepened in the first months of 2026.
Following the Supreme Court of the United States (SCOTUS) cancellation of the tariffs, imports gained 9% year over year in April 2026.
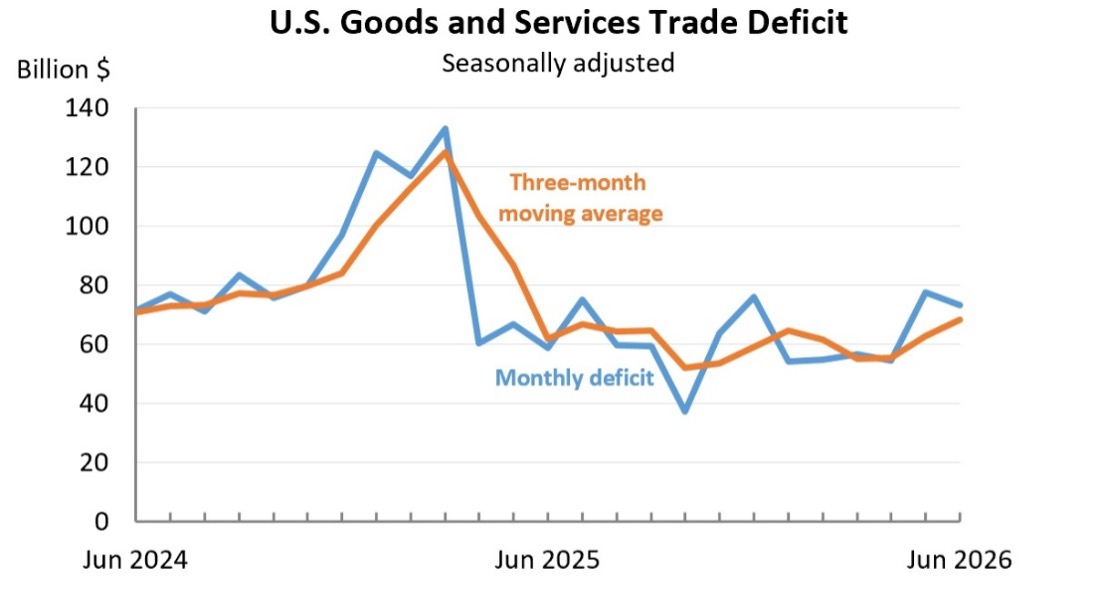
The knock-on effect of slowing imports has been to shrink the U.S. trade deficit. The trade gap fell to its lowest level in October 2025: $20.4 billion, a 39.0% decline from the preceding month. In June 2026, the gap was $73.3 billion, a 5.6% decline from May, the U.S. Bureau of Economic Analysis reported on August 4 (see Figure 2).
Figure 2. U.S. Trade Deficit in June 2026
Source: U.S. Bureau of Economic Analysis, August 4, 2026
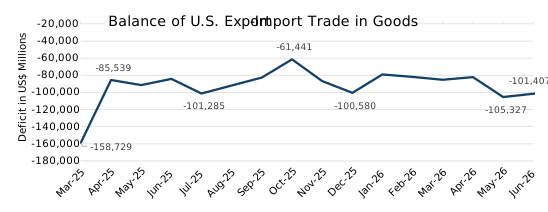
Imports and exports both declined in June 2026, but imports fell further. Census data spotlights the gap between exports and imports of goods before, during and after the IEEPA tariffs (see Figure 3).
Figure 3. Balance of U.S. Export-Import Merchandise Trade through June 2026
Source: U.S. Census Foreign Trade Data
North American Trade Partners Move to the Fore
The reciprocal tariffs unveiled in April 2025 were broadly applicable to most U.S. trade partners. The impact on U.S. import market share was not. Deferred implementation, subsequent modifications, and carve-outs for products dear to consumers or of critical importance to businesses worked to the advantage of some, and the disadvantage of others. The tariffs were announced with an invitation to bargain for a better deal.
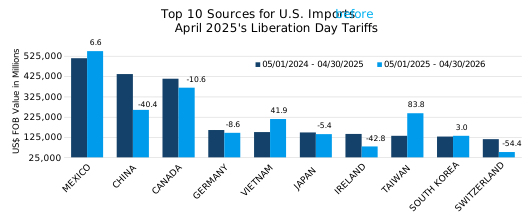
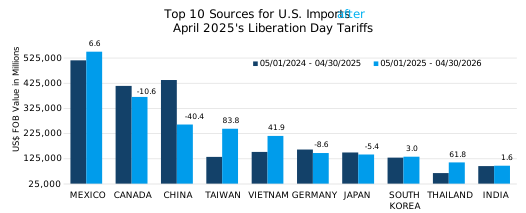
Based on Descartes Datamyne U.S. Census import data, Figures 4 and 5 show snapshots of the top 10 countries of origin for U.S. imports in the 12 months before and after the IEEPA tariffs launched.
Figure 4. Top Countries of Origin for U.S. Imports in the 12 Months before IEEPA Tariffs
Source: Descartes Datamyne U.S. Census Import Data
Figure 5. Top Countries of Origin for U.S. Imports in the 12 Months after IEEPA Tariffs
Source: Descartes Datamyne U.S. Census Import Data
In April 2025, the top countries of origin, Mexico, Canada, and China posted losses of 2.8%, 15.4%, and 19.8% respectively. Canada retaliated with a 25% tariff on a range of U.S. goods (since largely dropped). In the next months, Mexico secured its lead as top supplier with 6.6% growth for the year ending with April 2026. Imports from Canada fell 10.6%.
Further down the rankings, Taiwan (up 60.6%) and Vietnam (47.8%) led gains in April 2025. Both Taiwan and Vietnam negotiated reciprocal trade agreements with the U.S. Robust growth through the following year boosted these countries to the top five.
Imports from India, which had surged in the run-up to new tariffs, increased 26% in April 2025. The growth trend reversed as the U.S.–India trade crisis gathered steam over geopolitics through the summer months, with the U.S. tariff on Indian goods rising to 50% in August 2025. The U.S has since rolled back the tariff applied to India, and trade talks are in progress. Over the 12-month comparison period, India’s y-o-y gain was positive, albeit modest, growth of 1.5%, enough to carry that country into the top 10 import sources.
Variable Tariff Rates – Fluid Trade Agreements
Meanwhile, the U.S. uncoupling from China picked up momentum under the U.S. tariff regime, with China slipping from second to third on a 40.4% decline in exports to the U.S.
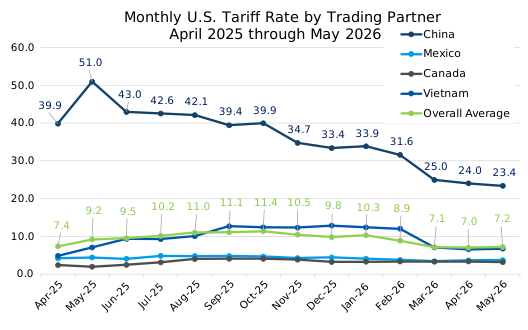
The re-ordering of top-ranked sources reflects the disparate tariff treatment accorded to each country. The University of Pennsylvania’s Penn Wharton Budget Model has been tracking effective tariff rates on U.S. trading partners; Figure 6 shows data covering April 2025 through May 2026.
Figure 6. Monthly U.S. Tariff Rate Applied to Top U.S. Trading Partners
Source: Penn Wharton Budget Model, updated July 13, 2026
Underpinning the month-to-month fluctuation in customs rates is a record number of revisions to the Harmonized Tariff System of the U.S. (32 in 2025, 15 in 2026 as of August 3), which is a rough measure of the volatility of the current tariff regime and the unprecedented economic uncertainty it creates.
Yet another source of uncertainty: U.S. trade agreements concluded since the start of 2025. The Council on Foreign Affairs reports that “all agreements include language that suggests room for constant modification and quick termination. The message is clear: a trade agreement no longer guarantees predictability in trade relations with the United States.”
Maritime Import Volumes Falter
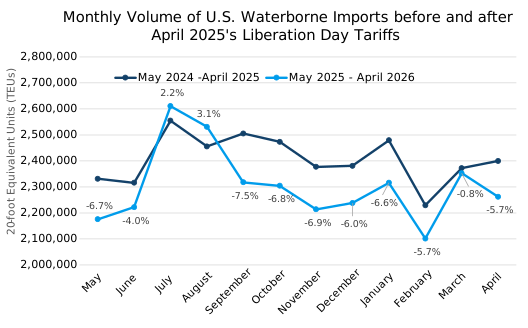
The volume of imports carried by ocean-going vessels also ebbed, with twenty-foot equivalent units (TEUs_ decreasing 4.3% in the 12-month period after Liberation Day, as bill-of-lading import data from Descartes Datamyne shows in Figure 7.
Figure 7. Comparison of Monthly Maritime Import Volumes in the 12 Months before and after IEEPA Tariffs
Source: Descartes Datamyne U.S. Bill-of-Lading Import Data
Alt: Line chart comparing monthly U.S. waterborne import volumes before and after the Liberation Day tariffs, showing lower year-over-year volumes for most months after the tariffs.
Inbound TEUs fell in the months after the IEEPA tariffs were unveiled, and then surged in July–August ahead of the tariffs’ effective date. From September 2025 through April 2026, volumes have lagged behind prior year levels.
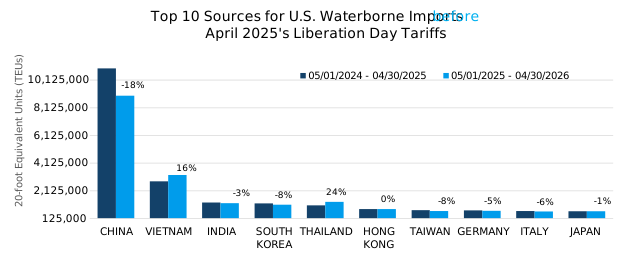
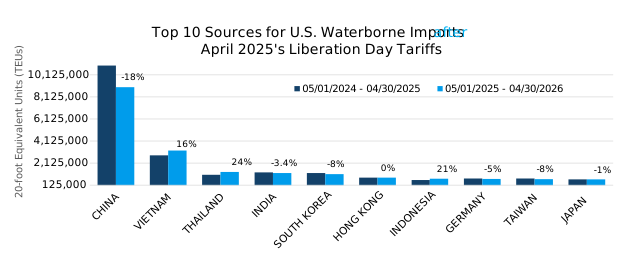
While China’s overall share of U.S. imports declined, it continues to dominate ocean-going trade, as Figures 8 and 9 show by comparing the top countries of origin in the 12 months before and after the IEEPA tariffs.
Figure 8. Top 10 Countries of Origin for U.S. Maritime Imports before IEEPA Tariffs
Source: Descartes Datamyne U.S. Bill-of-Lading Import Data
Figure 9. Top 10 Countries of Origin for U.S. Maritime Imports after IEEPA Tariffs
Source: Descartes Datamyne U.S. Bill-of-Lading Import Data
Despite an 18% drop in TEUs, China remains far and away the leader in this trade. Again, Vietnam is among the big gainers, with 16% growth in volumes shipped. Thailand (another country that reached an agreement on reciprocal trade with the U.S.) climbed to third-ranked with 24% growth, while Indonesia broke into the top 10 with 21%.
Note that Taiwan’s waterborne volume declined by 8%, even as Census data shows the value of imports from that source climbing 83% over the same period. The delta is because many of Taiwan’s higher-value, smaller-size exports, such as automated data processing (ADP) devices [HS85471], ship by air. Taiwan, the top supplier of ADP devices to the U.S., accounted for 39% these imports.
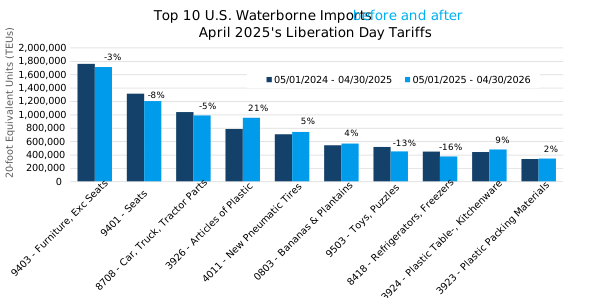
Figure 10 shows the top U.S. waterborne imports, ranked by TEUs, before and after the IEEPA tariffs:
Figure 10. Top U.S. Maritime Imports before and after IEEPA Tariffs
Source: Descartes Datamyne U.S. Bill-of-Lading Import Data
As a source, China has ceded leadership to Vietnam for U.S. imports of furniture [HS9403] (with a 31% share compared with Vietnam’s 34%) and seats [HS9401] (with 40% compared with 42%). China remains the top source for car and truck parts [HS8708] (31% share); articles of plastic [HS3926] (64%), toys [HS9503] (66%); fridges and freezers [HS8418] (41%); plastic kitchenware [HS3924] (70%); and plastic packing materials [HS3923] (43%).
Car Imports Fade, ADP Machines Surge
Exclusions and carve-outs have spared some import products the full weight of the IEEPA tariffs, depending on trade policy and other domestic market considerations of the moment. An example of the latter would be the exemptions granted a range of agricultural imports in a bid to lower the cost of groceries ahead of Thanksgiving in 2025.
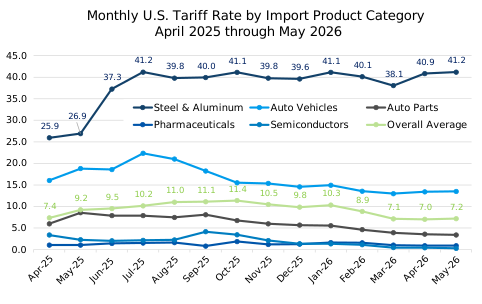
Generally, however, the goal of the administration’s tariff policies has been to protect and grow U.S. domestic industries in critical sectors. The Penn Wharton Budget Model tracking tariff rates by broad product category is an indicator of which sectors have been prioritized for protective tariffs, as shown in Figure 11.
Figure 11. Monthly U.S. Tariff Rate Applied to U.S. Critical Import Product Categories
Source: Penn Wharton Budget Model, updated July 13, 2026
High levies on steel and aluminum, via antidumping or countervailing duties, Section 232 or Section 301 tariffs, have long been part of the U.S. defensive playbook. Section 232 tariffs of 25% were applied to autos and auto parts in July 2025, but the rates were soon modified. (With the introduction of IEEPA tariffs, an executive order set rules that limit, but do not eliminate “stacking” the accumulating tariffs.)
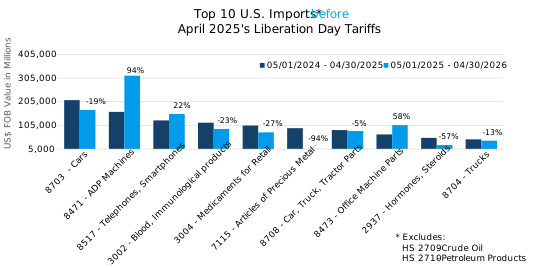
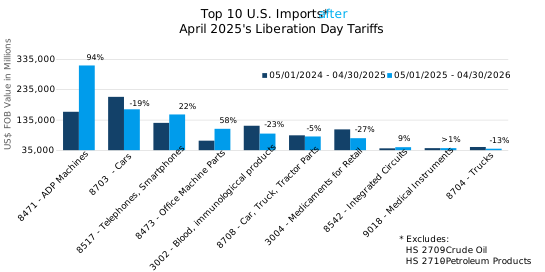
Descartes Datamyne U.S. Census data in Figure 12 shows significant declines in imports of auto vehicles, trucks, and pharmaceuticals after the tariffs:
Figure 12. Top 10 U.S. Import Products in the 12 Months before IEEPA Tariffs
Source: Descartes Datamyne U.S. Census Import Data
Note the exclusion of crude oil [HS2709] and petroleum products [HS2710], ranked fourth and twelfth by value in first-half 2026, in order to focus on merchandise trade in the comparison charts. While oil is subject to tariffs (including the 10% Section 122 surcharge introduced in February), there are overarching geopolitical variables determining fluctuating import values.
Figure 13. Top 10 U.S. Import Products in the 12 Months after IEEPA Tariff Launch
Source: Descartes Datamyne U.S. Census Import Data
Automobile [HS8703] imports dropped -9% and slipped to a distant second in the rankings behind ADP machines [HS8471], helped along by Section 232 duties. The surge in ADP machines contributed to Taiwan’s rise among the top countries of origin. Thailand, another rising country of origin, accounts for 35% of U.S. imports of integrated circuits.
The virtual shut-down in imports of articles of precious metals [HS7115] (94%) helps explain Switzerland’s fall from the top 10 to No. 16 among countries of origin. These products accounted for fully half of that country’s exports to the U.S. Switzerland’s trade was also dented by tariffs targeting pharmaceuticals, as was Ireland, No. 7 before and No. 11 after.
U.S. Tariffs 2.0
As noted, blanket tariffs of 10% were imposed immediately after the IEEPA duties were declared illegal. These Section 122 tariffs came with an expiration date of July 24. On July 24, levies of 10% or 12.5% were imposed on imports from 60 trading partners under Section 301. The applicable rate is tied to the trading partner’s efforts to prohibit products of forced labor.
More tariffs are in the pipeline: as the Economist reported, Section 301 investigations into structural excess capacity among 16 trading partners are expected to result in a fresh round of tariffs later this year.
How Descartes Datamyne Can Help
As tariffs and trade relationships continue to shift, access to timely, detailed trade data can help businesses understand where markets are moving. Descartes Datamyne provides U.S. Census and bill-of-lading data to help organizations track import trends, monitor competitors, evaluate suppliers and markets, and identify changes in global trade flows.
See what shifting trade patterns could mean for your business.
Explore Descartes Datamyne and schedule a demo.