


After flat sales growth in 2022, toy manufacturers and importers bet on lean inventories in the 2023 run-up to the year-end holiday gift-giving season, Descartes Datamyne trade data shows. Changing consumer tastes and inflation’s toll on household budgets encouraged retailers’ cautious outlook. The result is an early and shallow peak season for toy imports.
Key takeaways:
- Key trade data indicates an early and shallow peak season for toy imports in 2023, with manufacturers and importers relying on lean inventories after flat sales growth in 2022.
- Changing consumer tastes, inflation pressures, and cautious retailer outlook contribute to a subdued growth in toy imports, creating a contrast with overall U.S. waterborne import trends.
- Toys, games, and sports equipment maintain a strong presence among the top 2023 U.S. containerized imports, ranking 6th by volume (TEUs), accounting for 4.2% through October.
- Available data highlights a shift in toy imports from traditional toys to high-tech playthings like video game consoles, reflecting a broader trend of children abandoning traditional toys for digital alternatives.
- U.S. toy manufacturers grapple with the risks of supply chain disruptions, especially as most toys are imported from China. Efforts to de-risk include near-shoring strategies, but the trajectory remains largely unchanged.
- Descartes Datamyne offers comprehensive global trade data and intelligence, empowering companies to navigate challenges, spot shifts in supply and demand, and optimize trade strategies in the ever-evolving toy industry.
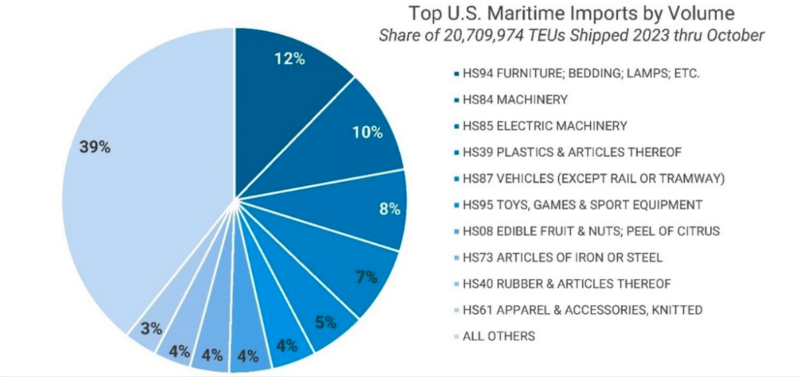
U.S. consumers’ love of playthings – from teddy bears to golf clubs, board games to video game consoles – keeps that category of trade goods, denoted by HS95 in the harmonized system of tariff codes, among the top 10 by volume of U.S. containerized imports. As Figure 1 illustrates, toys, games & sport equipment ranks 6th, accounting for 4.2% of inbound shipment volume (measured in 20-foot-equivalent units, or TEUs) this year through October.
Figure 1 Top U.S. Containerized Import Product Categories by TEU Volume
Source: Descartes Datamyne
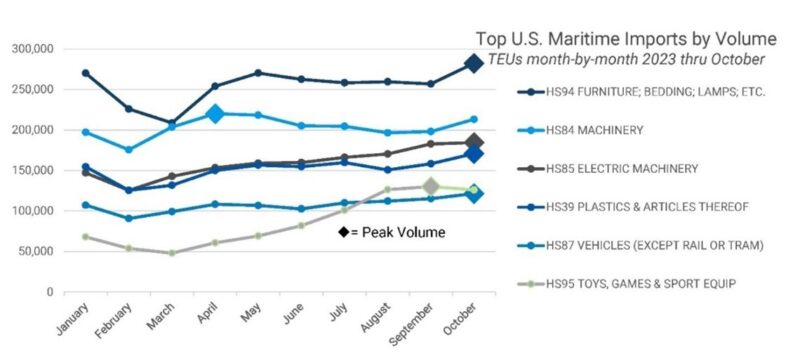
Traditionally, HS95 import volumes start the calendar year well down the rankings with a share in the 2.5-3.0% range and climb to a mid-autumn peak as retailers stock up for the holidays. Toy imports also move up in the volume rankings to No. 5 during the peak.
This year, the Descartes Datamyne bill-of-lading trade data shows (see Figure 2), toy imports reached their highest point in September, a month earlier than the other volume leaders.
Figure 2 Top Containerized Imports Monthly TEUs 2023 through October
Source: Descartes Datamyne
This year’s toy import volumes are also out of step with U.S. containerized imports overall. As our November 28 Data Snapshot reports, U.S. waterborne import volume consistently increased from September to October over the past six years – albeit a modest .2% in 2022.
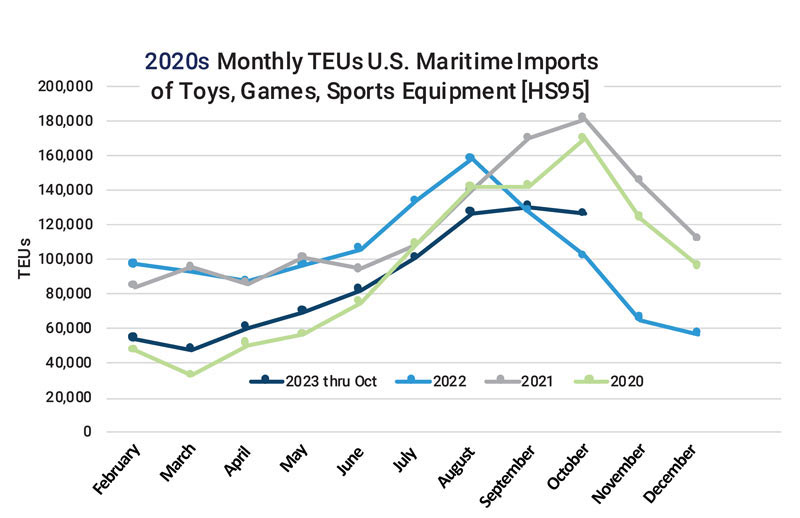
As the chart below captures, this year’s subdued growth in toy imports is in sharp contrast to the October volume peaks of 2020, when shipping tried to make up for nine months of pandemic shut-downs, and 2021, when toy imports surged on pent-up demand, helping to lift inbound waterborne shipments to near record highs, even as port congestion began to snarl supply chains.
Pandemic era disruption continued to impact peak shipping trends into the next year. The trade data in 2022 indicated a seasonal shift in retailers’ stocking strategies. Anticipating continued shortages due to supply chain bottlenecks, retailers purchased record stockpiles of inventory from toy manufacturers and urged consumers to shop early before shelves emptied. Then economic headwinds slowed consumer buying, and retailers began luring shoppers with deep discounts and promotions well before summer’s end. Toy imports plummeted. Toy sales fell short of 2021 levels , according to market researchers The NPD Group.
Determined to avoid being stuck with excess inventories in 2023, importers trimmed toy orders, as the chart makes plain. (See Figure 3).
Figure 3 U.S. Waterborne Imports of Toys, Games, Sports Gear Month-by-Month 2020-2023
Source: Descartes Datamyne
Their caution appears to have been warranted. As the Wall Street Journal reports, this year’s sales of toys and games through the end of September were down 8% compared with 2022. Again, the pandemic has been partly to blame: now that people are going outside again, indoor playthings are no longer in high demand. Of course, inflation and rising credit card debt could also depress holiday spending. Optimists point out that even budget-conscious parents resist stinting on presents for their kids. But no one is ready to call this year’s shopping season until it’s over.
Longer Term Trends in Play
We surveyed the business risks reported by the publicly-held companies that are among the top U.S. toy brands. While betting right on the next must-have toy trend, hedging against economic dips, and avoiding supply chain disruptions (more on that below) are common strategic goals, a more existential challenge confronts toymakers.
Year-by-year, children are abandoning traditional toys and games and clamoring for hi-tech playthings, such as video games, consumer electronics, and social and digital media, at increasingly younger ages. It is telling that, in reporting depressed pre-holiday toy sales, the Wall Street Journal cites declines in imports of bicycles (down 40%) and smartphones (down 16%), an electronics product denoted by HS851713, as examples.
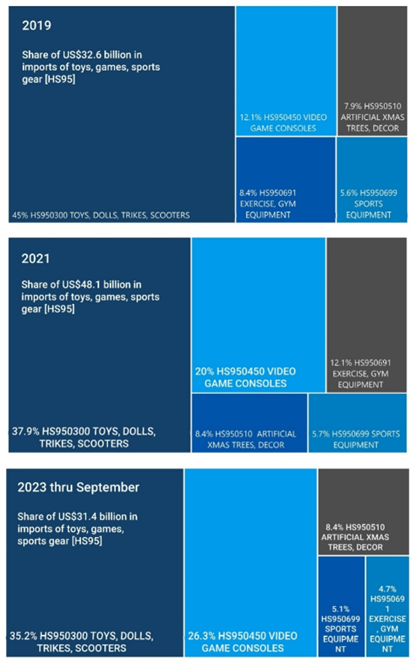
Descartes Datamyne trade data captures the shift in toy imports from (non-digital) toys and games to video game consoles. Pre-pandemic, toys accounted for 45% of import trade value, while consoles commanded a 12% share. Post-pandemic, toys have ebbed to 35%, while game consoles account for 25% of this year’s import value. Note, too, the increased share for indoor exercise equipment during the pandemic, now subsided, as the next charts illustrate. (See Figure 4).
Figure 4 Top Toy Product Categories by Value before, during and after the Pandemic
Source: Descartes Datamyne
In addition to looking for ways to update toy product lines with more digital bells and whistles, toymakers are inspired by the new lease on life of a fashion doll brand introduced in 1959 following last summer’s blockbuster movie of the same name. The quest is on for more story-led franchises generating demand not only for toys but for games, play, and experiences across multi-media.
China De-Risking: Easier Said than Done
Most toys sold in the U.S. are imported. Most imported toys are made in China. The risks of disruptions in supply chains dominated by a single country are universally recognized by toy companies. But, as with efforts to de-risk semiconductor manufacturing, it’s easier said than done. Unlike chips-making, toymaking is not a candidate for re-shoring in the interest of national security. Making toys in the U.S. would mean boosting prices in the face of declining sales. So top toy manufactures in the U.S. are looking at moving production (and supply of inputs) to other countries – a strategy the Financial Times calls near-shoring or friend-shoring, citing one U.S. toy company that has shifted production to Mexico, Malaysia, and Vietnam.
Still, with the exception of an October downturn, the trajectory of inbound shipments from toy suppliers – and China’s commanding share of toy manufacturing – looks little changed in 2023 from 5 years or 10 years ago, as the next charts illustrate. (See Figure 5).
Figure 5 China’s Share of U.S. Waterborne Toy Import TEUs Month-by-Month in 2023, 2018, and 2013
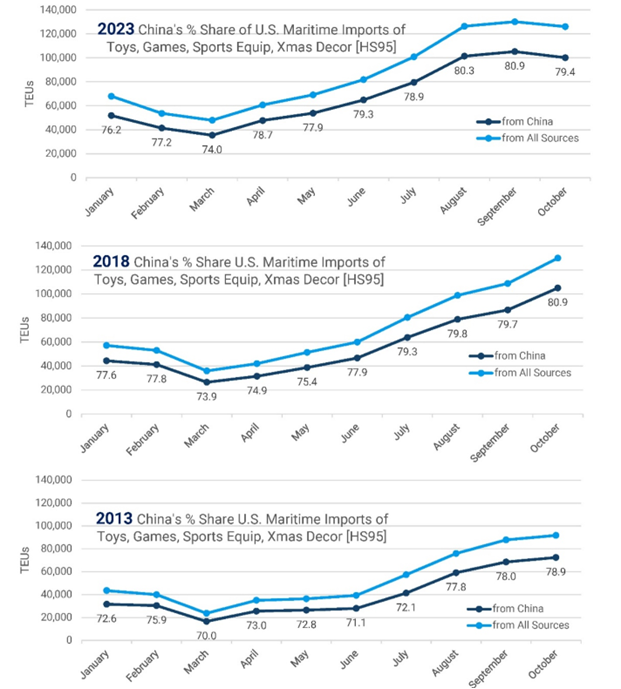
Source: Descartes Datamyne
Points to Note
Our focus here has been on the seasonal peak in shipping for waterborne imports of toys. But no one data set can provide a complete picture of global markets. Descartes Datamyne Census data captures the U.S. import trade in toys that arrive by air, rail, and truck (and shows Vietnam’s share by value of this trade reached 7.8%, while Mexico was the source for 6.1% in the first nine months of this year). Our Mexico data yields additional detail about this trade, including the exporters and customers for toys made here (led by maker of highly popular little plastic blocks).
Descartes Datamyne Global Trade consolidates the information from all the transaction records in our U.S. and international databases to identify the company sources, end-users and intermediaries on the buy- and sell-side of trade in products at each stage of the value chain.
How Descartes Datamyne Can Help
Descartes Datamyne delivers global trade data and intelligence with comprehensive, accurate, up-to-date, import and export information that helps companies save significant time in spotting supply and demand shifts, optimizing trade lanes, expanding into new markets and identifying new buyers and suppliers.
Datamyne features the world’s largest searchable trade database covering 230 markets across five continents. Gathered directly from official filings with customs agencies and trade ministries, including bills of lading, our data is detailed (down to company names and contact details), timely and authoritative.